Economists make it linear again.
Comment on It's barely a science.
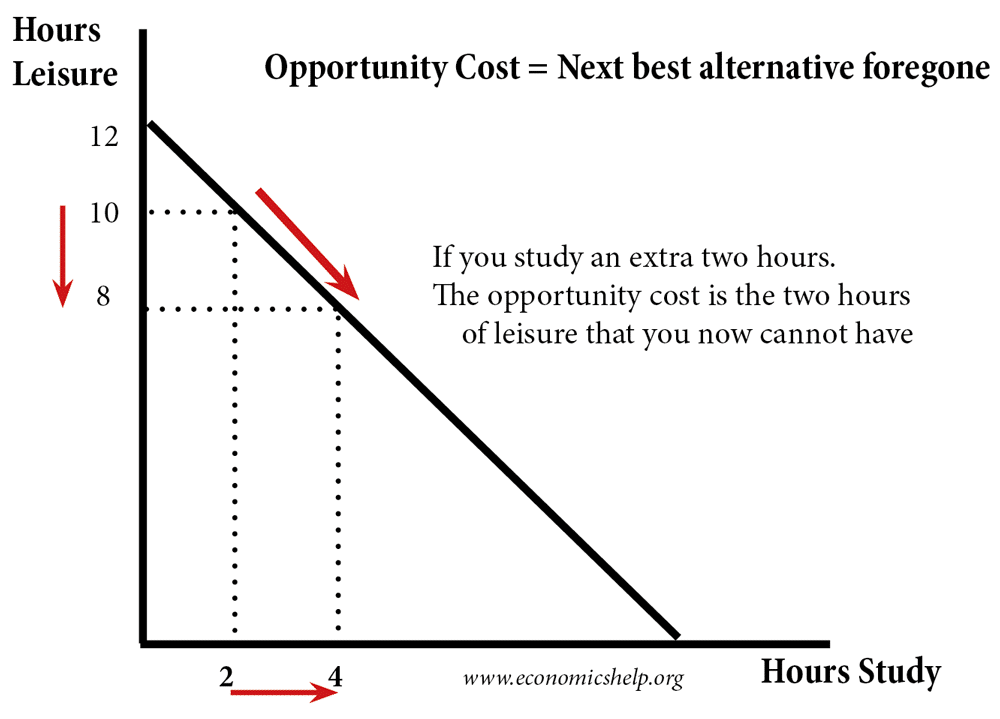
HeyThisIsntTheYMCA@lemmy.world 5 months agolet’s talk about opportunity cost. did you learn that?
Knock_Knock_Lemmy_In@lemmy.world 5 months ago
HeyThisIsntTheYMCA@lemmy.world 5 months ago
Knock_Knock_Lemmy_In@lemmy.world 5 months ago
Hilarious.
Check out the supply/demand Figure 4-8 on page 80
Economists can’t handle non-linear relationships.
Prosecution rests.
HeyThisIsntTheYMCA@lemmy.world 5 months ago
what is it trying to illustrate in the model?
HeyThisIsntTheYMCA@lemmy.world 5 months ago
first: neither brittanica nor investopedia are run by or written by economists. those images were made, probably in excel first, they’re terrible, and then considered done. how much longer does it take to get a set of curves that line up precisely in the center versus a set of straight lines that line up precisely in the center? especially when the point you’re trying to illustrate with your diagram is not (a) the more realistic shape of the utility curves that define the supply and demand curves, but is in fact (b) the equilibrium point at the intersection. it takes a lot longer to get the curves right, right? and that’s not the important part of the model! better to just save 15 seconds and use straight lines, you can illustrate the curves on another diagram
that is how economists think
that is why those stupid images are there.